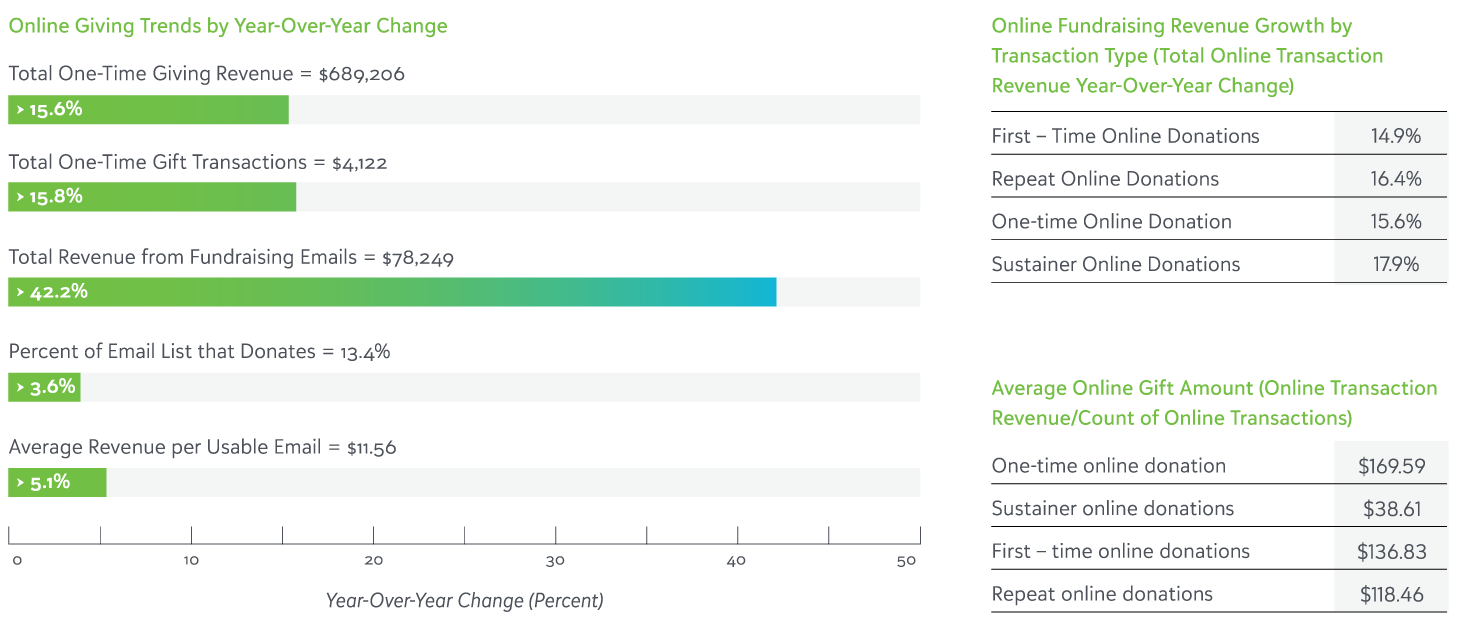
As the world became more comfortable living online during COVID-19, constituents started to shop, work, socialize–and donate–more online in 2020. While overall giving grew 2% in 2020 (source: Blackbaud Institute Charitable Giving Report), one-time online gift revenue increased 15.6% in 2020. This digital growth resulted from donors responding to an emergency and transitioning their lives–and donations–online.
One-time online giving revenue grew across 11 of 12 sectors in 2020 (Health Services and Research is the exception with a -18.8% decrease).
Food Bank one-time gift revenue grew an eye-popping 453%.
The early part of COVID-19’s emergency giving window really set the tone for online giving.
Food Bank revenue skyrocketed by 1,033% year-over-year in March and increased by 2,813% in April.
Food Banks, Faith Communities, and Public Broadcasting—who had the highest one-time giving growth overall in 2020—saw the largest increases in one-time giving in April 2020.
It was the donations Food Banks received in these two months that drove the overall increase.
Overall, one-time online giving revenue had two spikes in 2020: from May to July and October to December. Revenue increased more than 18% during these months. The highest month was May, where one-time gift revenue increased by 44.9%.
A new, but familiar Giving Day, GivingTuesdayNOW on May 5, may have helped drive this increase by nudging nonprofits hesitant to fundraise during the pandemic, highlighting struggling nonprofits, and rallying donors to give generously to causes they support.
After May, the next biggest one-time giving growths were in November (38.9%) and December (29.6%) 2020.
At the end of 2020, as in-person events remained cancelled and the pandemic worsened, the stock market ended 2020 at an all-time high and donors continued to adapt to living their lives online. This mix led donors to be extra generous with their year-end online gifts.
Also of note, repeat online donor revenue (16.4%) slightly outpaced first-time online donor revenue (14.2%) in 2020. However, for the three sectors with the largest one-time online growth in 2020 (Food Banks, Faith Communities, Public Broadcasting), first-time online donor giving grew twice as fast as repeat online donor giving.
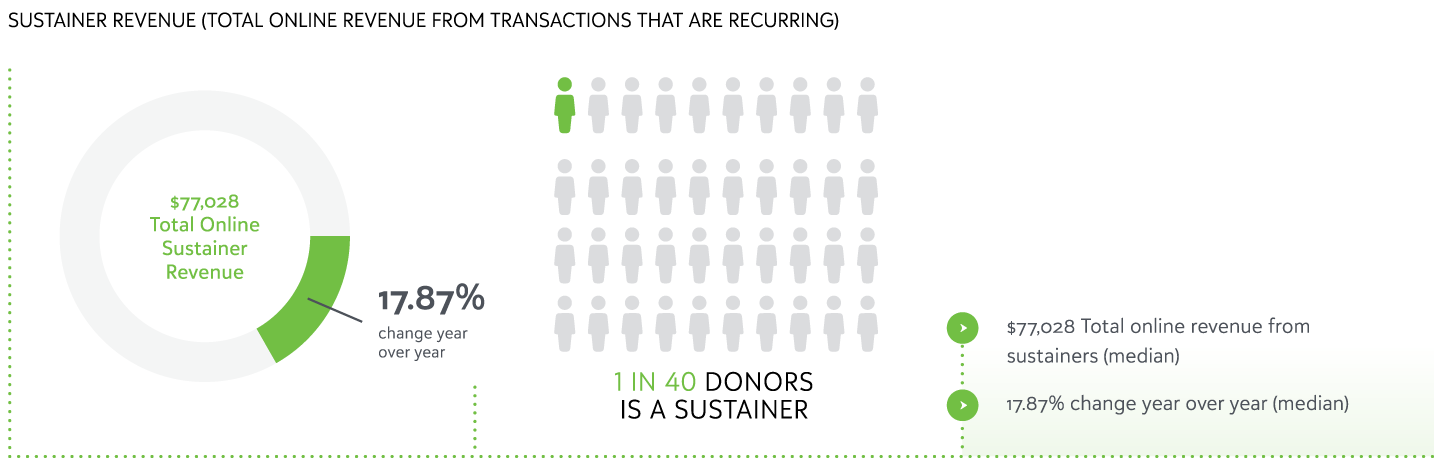
Sustainer donors, or recurring monthly donors, continued to grow in 2020 across all sectors.
Revenue increased at the median by 17.87%, rising to $77,028.
Sustainer transaction count increased at the median by over 19%.
The number of sustainer donors in 2020 was 331, up by over 18% YOY.
The median share of all online donors making a sustainer gift in 2020 was steady at 2.6%.
Of note in 2020 was strong and steady growth in sustained giving revenue each month. Year-over-year sustained giving revenue increased between 14% to 20% every month in 2020. This was on the heels of month-after-month growth in 2019. This data suggests that sustainer giving is a key strategic component for donor file health for a broad range of organizations.
An interesting finding in the Blackbaud Luminate Online Benchmark Report results is the very high and growing average gift for sustainers. In 2020, the median average gift for sustainers was $38.61, up by nearly one dollar from the 2019 median average sustainer gift for this data set. This a very high median average—organizations with strong sustainer programs typically see average gifts in the low to mid-$20 range.
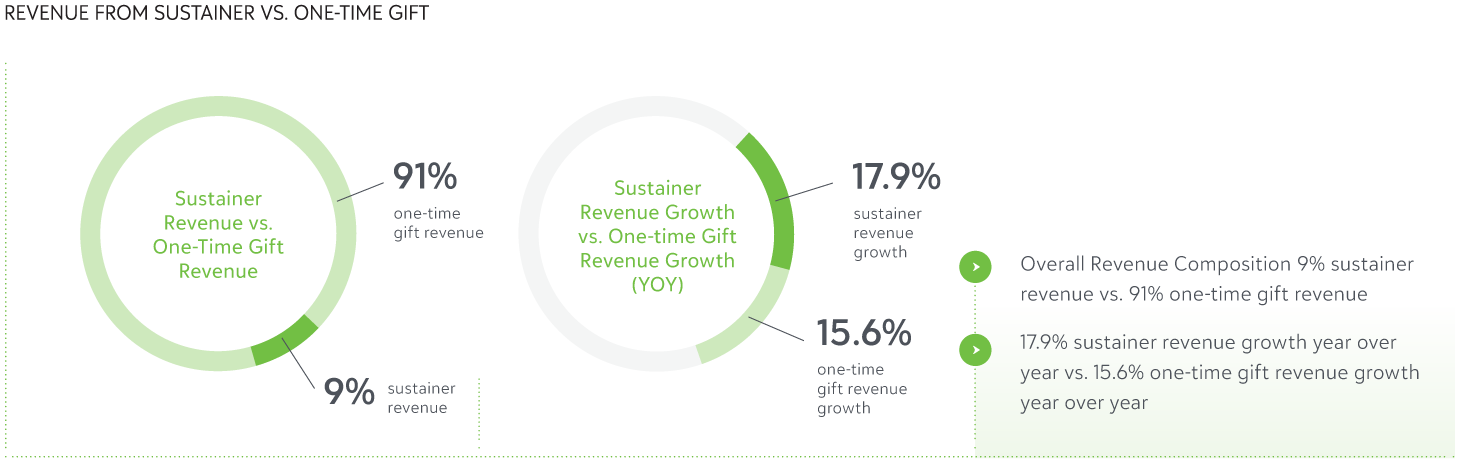
For the 9th Blackbaud Luminate Online Benchmark Report in a row, sustained giving revenue has grown faster than one-time giving revenue year over year. While sustaining donor counts, value, and revenue increased in 2020, the median share of sustainer giving online declined from 11% in 2019 to 9% in 2020. For those with a decline in the share of online donors that made sustaining gifts, this is not surprising as emergency giving sparked by the pandemic, the social justice protests, and natural and manmade disasters was often in the form of a one-time gift, changing the revenue composition during this tumultuous period.
Despite this trend, several sectors did show greater year-over-year increases in sustainer giving:
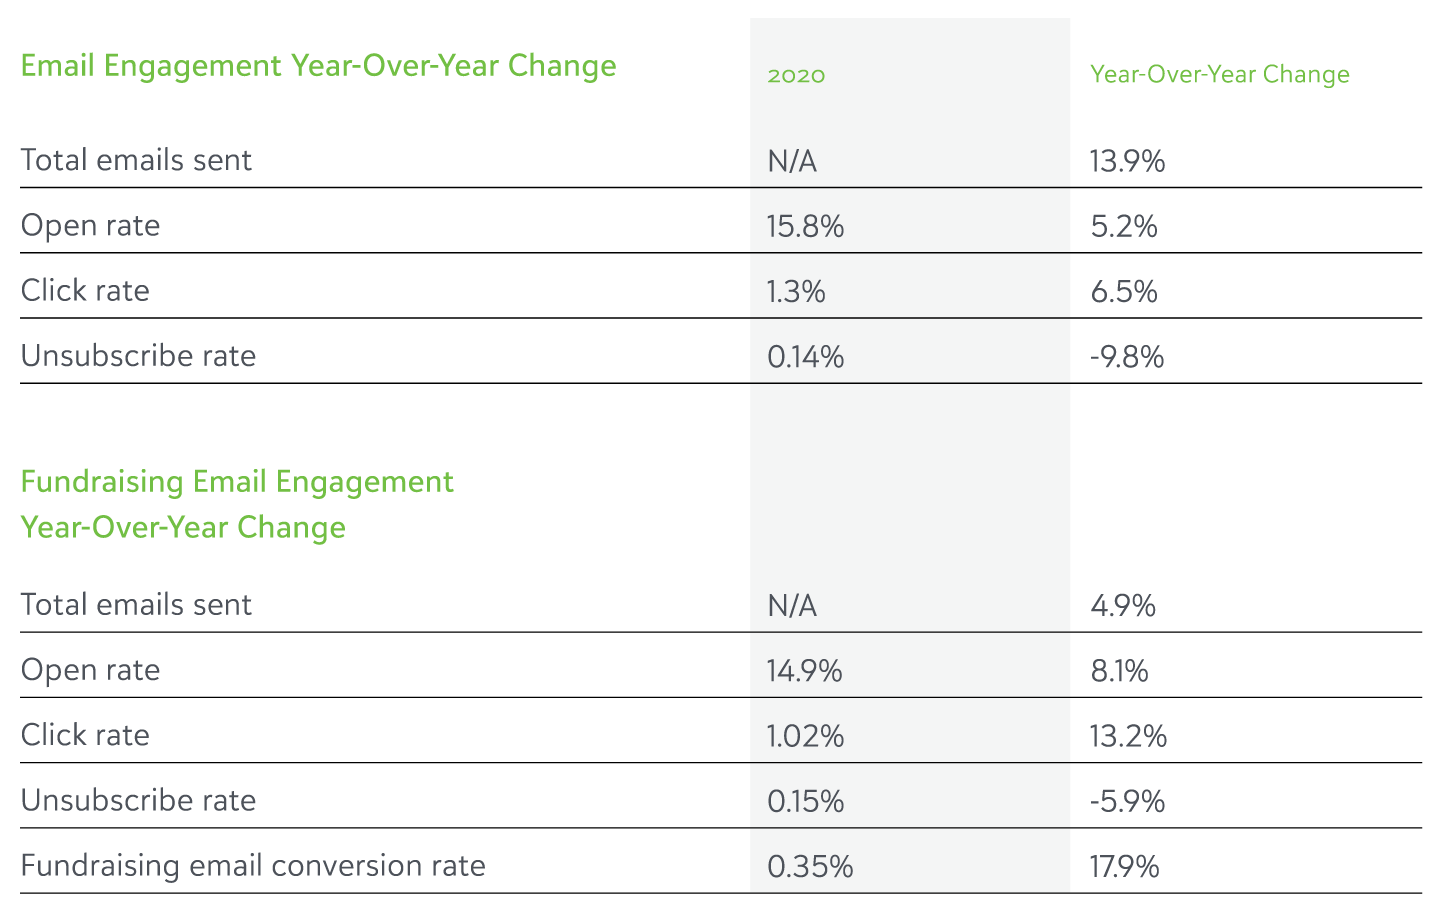
Organizations who have spent the past few years focused on email performance and deliverability were rewarded in 2020 because their email lists and programs were a step ahead—ready to meet the demand with the elimination of in-person events, canvassing, and giving opportunities.
Organizations sent 13.94% more emails in 2020 than in 2019.
Fundraising email revenue grew by 42.4% and transactions increased 43.2%.
1 in 286 people who receive a fundraising email donate.
After decreasing 13 of the previous 14 months, fundraising email revenue spiked 103% combined in March, April and May 2020. From June to December, fundraising email revenue was up 26%. This suggests that fundraising emails helped drive emergency giving at the start of the pandemic, but the year-end surge in one-time giving was driven by a more diverse mix of online channels.
While email addresses on file were up 7%, usable emails (opted into email) were only up 4%. This could point to fewer people wanting to receive email, even if they show a strong affinity for the organization by taking other online actions like making a gift or attending an event. That’s ok! You only want those who will truly engage with your email programs to opt in. The others you can hopefully engage on their platform of choice. Email certainly isn’t dead but diversity in your marketing reach is important.
A reduction in the usable % of email housefile may also relate to careful data hygiene efforts. Removing non-performing email addresses or cleaning data for validity may also show this metric in the negative but it results in a higher performing list overall.
Many organizations have made a valiant effort over the last few years to remove disengaged constituents and poor-quality data to improve their sender reputation, inbox placement, and email performance. While usable housefile size increased just 4%, the email performance far exceeds that leading to higher quality names!
The organizations that have taken difficult steps to improve deliverability have seen total opens improve because their messages are getting through to readers. This is a huge victory!
Instead of looking at open and clickthrough rates, let’s look at totals to assess email performance. It’s expected that a smaller audience size will deliver a huge increase in rates. The real positive is that total opens and clicks are also up.
Active email lists might not be growing by leaps and bounds any more, but our email performance shows that by carefully cultivating a healthy,
smaller list, you’re better off.